Cart0
you have no items in your shopping cart.


Before dissecting the unusual market dynamics of 2026, it is worth grounding the analysis in two foundational concepts that govern how capital flows around the world: risk-on and risk-off.
Written by: Tony Coleman
Table of Contents
Risk-on is the market posture adopted when investors feel confident about the economic outlook. In a risk-on environment, capital flows away from safe havens and toward higher-yielding, higher-volatility assets – equities, emerging market currencies, commodities with industrial demand profiles, and speculative instruments. The investor’s implicit message is: growth is probable, I am willing to take on uncertainty for reward.
Risk-off is the opposite. When fear, uncertainty, or deteriorating economic data dominates the mood, capital retreats to perceived safety: US Treasury bonds, the Japanese yen, the Swiss franc, and – historically and reliably – gold and silver. The investor’s message shifts to: preservation matters more than return; give me assets that hold value when everything else falls.
Gold, in particular, has been the archetypal risk-off asset for millennia. It carries no counterparty risk, cannot be printed by a central bank, and has an 5,000-year track record as a store of value. Silver shares these properties but with an important distinction: it is also an industrial metal, with deep demand from solar panels, electronics, and medical technology. This dual nature makes silver more volatile than gold – it tends to amplify gold’s moves in both directions, falling harder in corrections and surging more explosively in bull phases.
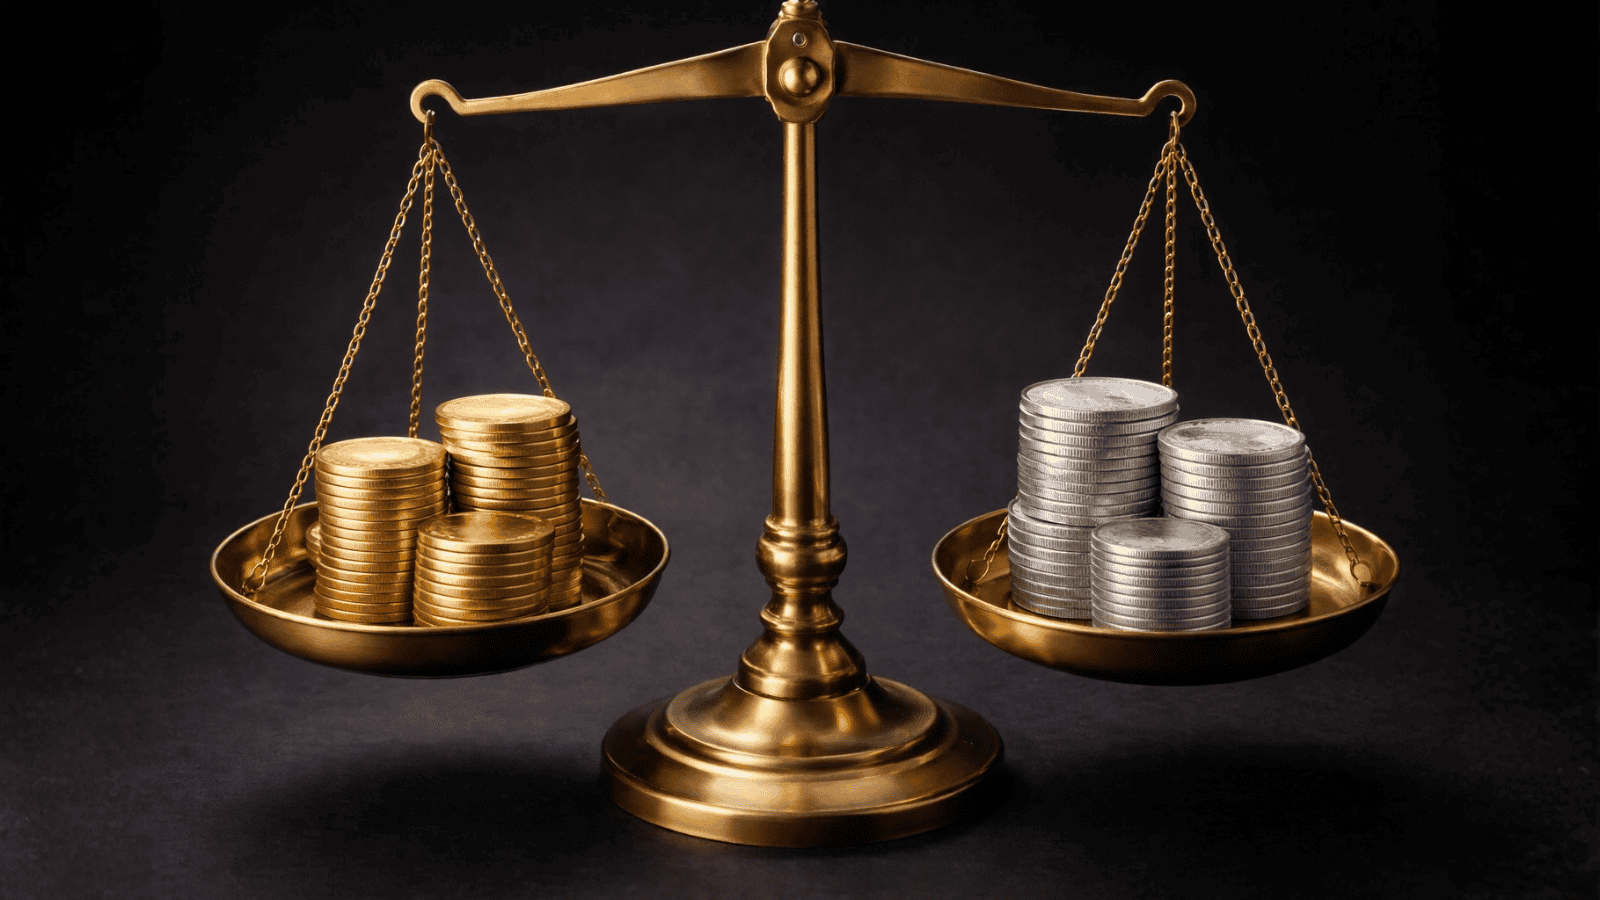
The gold-silver ratio – how many ounces of silver it takes to buy one ounce of gold – is one of the most watched gauges in the precious metals complex. When the ratio rises sharply (silver underperforming gold), it typically signals either risk-off stress in the industrial economy or a speculative unwind. When it compresses, it often marks the early stages of a broader metals rally, with silver leading from the front.
Understanding these mechanics is essential to grasping why 2026 has produced one of the most counterintuitive precious metals markets in modern history.
The conventional playbook is simple. A major geopolitical shock – an invasion, a blockade, a conflict in an oil-producing region – triggers fear. Fear triggers risk-off. Risk-off sends money into gold. Gold rallies.
This is what happened in February 2022, when Russia entered Ukraine and gold gained 1.7% intraday. It is what happened in May 2019, during the last significant US-Iran standoff in the Strait of Hormuz, when gold rose approximately 2% in a single session.
The US-Iran conflict of 2026 broke this pattern in a dramatic and instructive way.
Gold had already reached a record high of $5,608 per ounce in late January 2026, driven by mounting diplomatic pressure over Iran’s nuclear programme and a broad structural bull market built on central bank accumulation, ETF inflows, and a weakening dollar narrative. By the time coordinated US-Israel strikes on Iran triggered the effective closure of the Strait of Hormuz on March 1, gold briefly tested $5,400 – and then it broke down. By early June 2026, gold had fallen approximately 23% from its January record, trading near $4,328. Silver’s correction was even more savage, collapsing roughly 44% from its high above $121 to approximately $67.30.
These declines happened not despite the war, but because of the specific economic mechanism the war set in motion.
The Strait of Hormuz is an eighteen-mile-wide waterway between Oman and Iran through which approximately 20% of the world’s traded oil transits. When Iran effectively closed it in early March 2026, the global energy market faced its most acute supply shock since the 1973 oil embargo. West Texas Intermediate crude surged above $110 per barrel – a 66% increase from pre-conflict levels – while Brent crude approached $112.
This is where the mechanics become critical, and where gold’s traditional role as a war hedge was overridden by a more powerful force.
Surging oil prices are inherently inflationary. Energy costs feed into every layer of the economy – transportation, manufacturing, agriculture, services. When oil spikes sharply and sustained, consumer price indices follow. US CPI printed at 3.8% year-over-year in April 2026, its highest reading since May 2023. The ISM Manufacturing Prices Paid component came in at 84.6 in the same period – the highest since April 2022 – with a three-month surge representing the largest in the ISM series.
This inflation surge placed the Federal Reserve in an agonising bind. Before the conflict began, markets had priced in multiple rate cuts for 2026. Those expectations evaporated almost immediately. With energy-driven inflation re-accelerating, the Fed could not ease monetary policy – doing so would have risked embedding inflation expectations and repeating the policy mistakes of the early 1970s. The Fed held rates restrictive. The FOMC’s March 2026 meeting minutes revealed policymakers explicitly concerned that sustained Middle East hostilities could require further rate hikes, not cuts.
Restrictive interest rates are the adversary of non-yielding assets. Gold earns no interest. When a US Treasury bill offers 4.5% and gold offers 0%, the opportunity cost of holding gold is substantial. Institutional investors ran that calculation and adjusted their portfolios accordingly – liquidating precious metals positions to secure liquidity, rotating into dollar-denominated instruments that actually paid yield in a high-rate environment.
The US dollar strengthened as a result. In a world where the Fed was frozen at restrictive rates while other central banks faced their own recalibrations – markets pricing in Bank of England hikes and ECB rate increases – the dollar’s yield advantage attracted global capital. As gold dealers noted, the Strait situation created a feedback loop: oil up, inflation up, rates held higher for longer, dollar stronger, gold under pressure.
The war that should have sent gold to $7,000 sent it to $4,300. This is the Iran Paradox.
Understanding support levels in precious metals requires thinking on multiple timeframes simultaneously: the immediate technical picture, the medium-term structural picture, and the long-term macro picture.
From a technical standpoint, gold’s correction has tested and is currently defending a cluster of levels that carry significant analytical weight.
The $4,313–$4,186 zone represents the first major structural floor of the correction period. This band encompasses the 200-day simple moving average, a long-term dynamic support that acts as the market’s mean reversion anchor. Gold broke below the 200-day SMA in early June 2026 – an event that typically accelerates selling pressure as algorithmic strategies respond to the breach. The next meaningful level sits at $4,254, followed by $4,186–$4,202 as a secondary technical floor.
Should selling pressure intensify, analysts identify $3,800–$4,000 as the area where longer-term structural buyers – particularly central banks and sovereign wealth funds – would likely re-enter at scale. Longer-term structural support remains at $3,000, though reaching that level would require a scenario where both the conflict resolves cleanly and the Fed pivots decisively hawkish – a low-probability combination.
Crucially, central banks have remained net buyers throughout the entire correction. JP Morgan projects approximately 755 tonnes of official sector purchases in 2026 alone, well above pre-2022 norms. Central banks have now been net buyers of gold for 17 consecutive years. This institutional bid beneath the market provides a structural floor that is not visible on a price chart but is very much present in the order book.
On the upside, gold faces resistance at $4,546 (a level that has capped multiple recovery attempts), then $4,917 (the 50-day moving average), with the critical test at $5,250–$5,430 – the zone where a weekly close above would reopen the path toward the all-time high at $5,608 and potentially the $6,000 threshold.
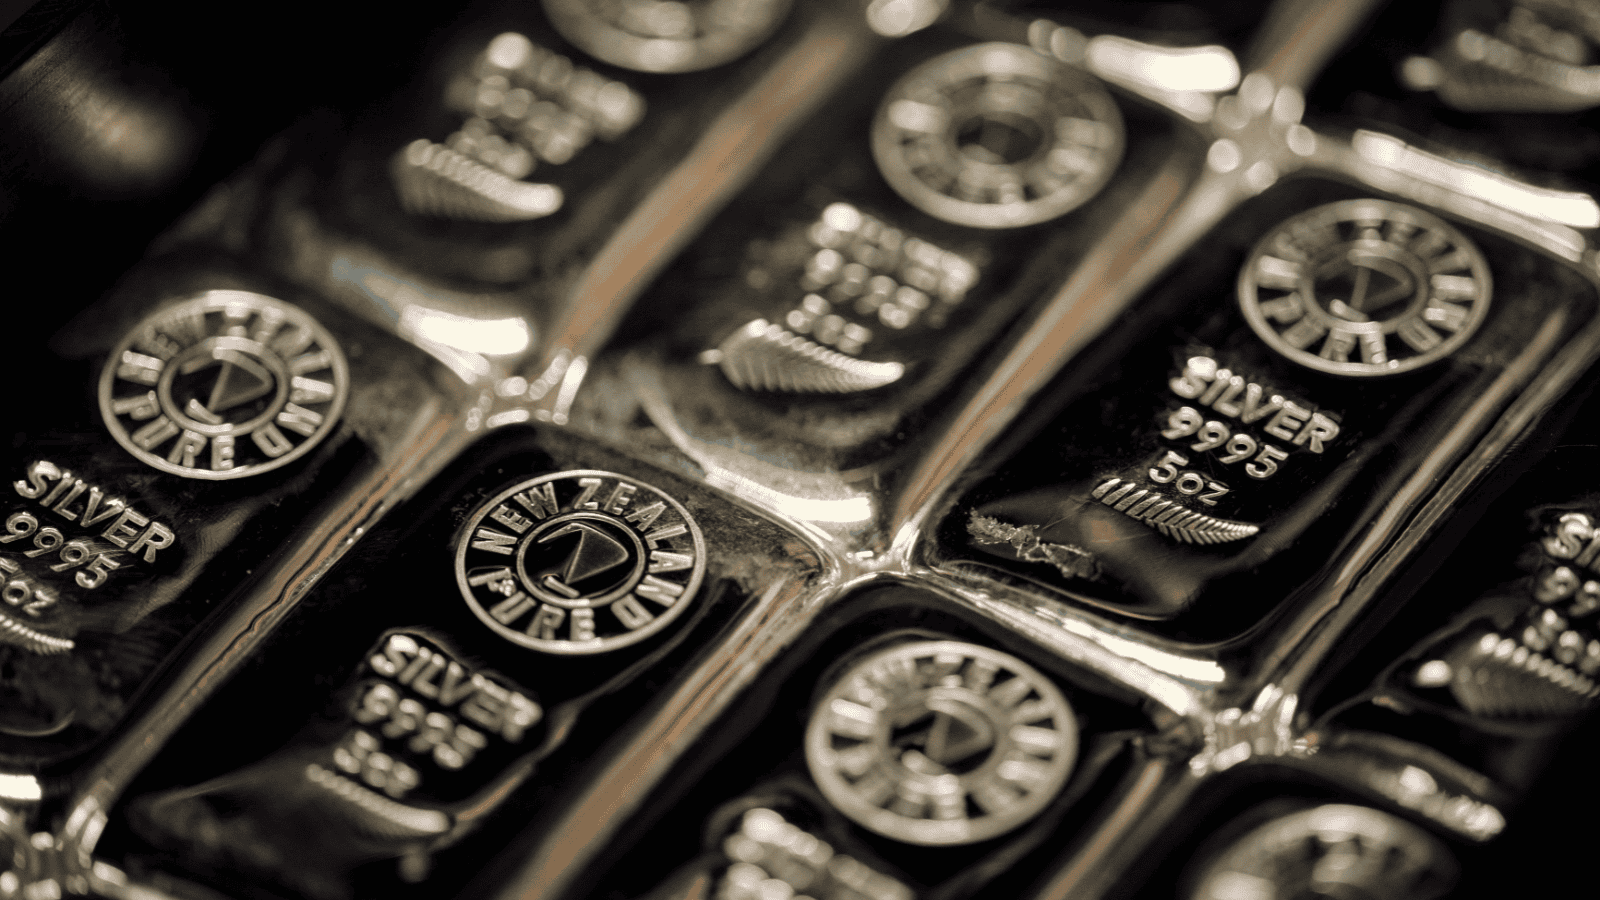
Silver’s correction has been far more severe, a textbook illustration of its leveraged relationship to gold. From its January 2026 high above $121, silver plunged to approximately $67.30 by early June – a 44% drawdown. This is not anomalous; it is characteristic. In corrections, silver’s smaller and more liquid market amplifies directional moves, making it a useful barometer for speculative sentiment shifts.
The technical support architecture for silver maps as follows:
The $66–$67 zone represents a critical secondary support level where the current market is testing its footing. The 200-day moving average near $64 acts as a rising dynamic floor – importantly, it continues to climb over time, potentially meeting price from below if the correction extends further. Analysts have identified $54–$50 as deeper targets should the $67 level fail decisively, though reaching those levels would require a materially negative macro shift beyond current conditions.
On the recovery side, silver must reclaim and hold above $70, then push through $76–$78 – a confluence of recent highs, psychological resistance, and Fibonacci extension levels from earlier rallies. A decisive close above this zone on strong volume would open the path toward $80–$82, with the broader structural bull case pointing toward $90–$96 and beyond.
The gold-silver ratio currently sits in elevated territory, consistent with silver having absorbed disproportionate correction pressure. Historically, when this ratio peaks and begins to compress, it signals silver is finding relative value – and often precedes an explosive outperformance phase for the white metal.
Perhaps the most compelling insight of 2026 has come from the market’s own behaviour during the brief ceasefire window in April, when Iran declared the Strait of Hormuz “completely open for the remaining period of ceasefire.”
The reaction was immediate and instructive. Gold rose 1.0–2.1% in a single session. Silver surged as much as 6.3% before giving back gains as equities rallied and profit-taking set in. Oil plunged more than 10%. The dollar weakened. Ten-year Treasury yields fell to 4.23%. And critically – market consensus for Federal Reserve end-2026 rates dropped below 3.50% for the first time since early March.
The market told us something important in that session: gold doesn’t need the war to rally – it needs the war to end.
This is the slingshot setup. Here is the sequence:
The Compression Phase. Every week the Strait remains closed adds energy to the coiled spring. Oil stays elevated. Inflation stays sticky. The Fed stays frozen. Gold stays suppressed. But the suppression is artificial – created by the same geopolitical event that structurally supports long-term precious metals ownership. The conditions underneath the current price are profoundly bullish: central banks buying at record pace, global de-dollarisation trends intact, real yields likely to turn negative once the Fed begins cutting, and an enormous amount of under-positioned institutional capital sitting on the sidelines waiting for clarity.
The Release Trigger. A credible, sustained reopening of the Strait of Hormuz changes multiple variables simultaneously, and this is what makes the slingshot so potentially powerful. Oil prices fall sharply. Inflation expectations decompress. The Fed’s hands are untied – rate cut expectations return to the table. The dollar weakens as yield differentials narrow. All of this happens at once, not sequentially.
As one analyst framed it precisely: in a ceasefire scenario, the dynamic flips – oil falls, inflation pressure eases, and rate-cut expectations start creeping back onto the table. That’s historically been one of gold’s most reliable tailwinds.
The Slingshot Dynamic. What makes this moment potentially more explosive than a typical geopolitical de-escalation is the combination of three factors operating simultaneously:
First, positioning. Speculative long positions in gold and silver have been significantly reduced during the correction. Institutional holders liquidated. Retail sentiment has turned negative. Short interest has built. This creates a coiled positioning setup – when the reversal comes, short-covering accelerates the move.
Second, structural buying. Central banks did not stop buying during the correction. They accelerated. JP Morgan confirms central banks purchased a net 244 metric tonnes of gold in Q1 2026 alone, the fastest pace in over a year. This structural bid is waiting to be supplemented by ETF re-accumulation and retail reinvestment the moment fear subsides.
Third, the inflation legacy. Even after a ceasefire, oil infrastructure damage, re-routing costs, and insurance premium recalibration mean energy prices will not immediately return to pre-war levels. Structural inflation pressures will linger – and gold thrives in inflationary environments over the medium term, even if short-term rate dynamics are moving the market in the opposite direction.
Goldman Sachs holds its year-end 2026 gold target at $5,400 per ounce. JP Morgan projects gold toward $5,000 by late 2026 and $5,400 by end-2027. Trading Economics forecasts a recovery to $4,942 within twelve months. The institutional consensus is not bearish – it is patiently bullish, awaiting the macro unlock that only a genuine Strait reopening can provide.
For silver, the potential move is even more dramatic. Silver broke out of a decade-long structural base in 2025, running over 300% in under a year. The current correction, while brutal in percentage terms, has not violated the structural thesis. If gold moves from $4,300 toward $5,400–$6,000 following a Strait resolution, history suggests silver could outperform by a factor of two to three. A move from the $67–$70 support zone toward $100–$120+ is not a fringe scenario – it is the base case among structural precious metals analysts, with the gold-silver ratio as the key leading indicator to watch.
The 2026 US-Iran conflict has created one of the most analytically fascinating precious metals environments in modern market history. Gold and silver fell sharply not because their fundamental investment case deteriorated, but because the specific mechanism of conflict – an oil price shock that froze the Federal Reserve – temporarily overwhelmed the traditional safe-haven bid and strengthened the very currency that gold competes against.
The current price levels represent a compressed spring. Every layer of analysis – technical support, central bank buying, positioning data, institutional price targets, and the market’s own behaviour during the April ceasefire – points to the same conclusion: the suppression is temporary, and the reversal, when it comes, will be sharp.
When the Strait of Hormuz fully reopens and the world’s oil lanes restore their normal flow, multiple bullish catalysts converge simultaneously. That is the slingshot. The only question remaining is timing – and that answer lies in the hands of diplomats in Islamabad, not traders on the COMEX floor.
Why did gold fall after the US-Iran conflict if gold is usually a safe-haven asset?
Because the oil shock pushed inflation higher, kept the Federal Reserve restrictive, and strengthened the US dollar. Those conditions raised the opportunity cost of holding non-yielding gold.
Why is silver moving more sharply than gold?
Silver is thinner, more speculative, and also tied to industrial demand. That gives it more upside in rallies and more downside in corrections than gold.
Why is the Strait of Hormuz so important in this story?
It is a major global oil chokepoint. When flows are disrupted, energy prices can jump quickly, feeding inflation and changing the market outlook for precious metals.
What price areas are traders watching in gold?
The article highlights the $4,313–$4,186 zone as the first major support area, with deeper structural support around $3,800–$4,000 and resistance back toward $4,546, $4,917, and $5,250–$5,430.
What would likely trigger the next major upside move?
A credible and sustained reopening of the Strait of Hormuz would likely lower oil prices, ease inflation pressure, weaken the dollar, and restore rate-cut expectations. That combination could unlock the slingshot move described in the article.
What should readers watch in silver?
The key levels highlighted are the $66–$67 zone, the 200-day moving average near $64, then $70, $76–$78, and eventually $80–$82 if momentum returns.


 How can I find out what my scrap gold or silver is worth before I sell it?
 Why Global Institutions Still See Gold as a Core Long-Term Investment
 When Gold Isn’t Gold: Why Buying Well Matters
 Markets jolt after U.S.–Israeli strikes on Iran – gold rises as investors seek safety
 Trading Gold vs Silver in New Zealand: Key Differences for Bullion Buyers